
|
| You might also like: | Star Classification - Types of Stars | Sun Puzzle - Zoom Astronomy | The Sun - Zoom Astronomy | Today's featured page: Rainforest Glossary - A: Zoom Rainforests |
| Table of Contents | Enchanted Learning All About Astronomy |
Site Index |
| Our Solar System | Stars | Glossary | Printables, Worksheets, and Activities | ||||||
| The Sun | The Planets | The Moon | Asteroids | Kuiper Belt | Comets | Meteors | Astronomers | ||
 |
|||||||
| A | B | C | D | E | F | G | H | I | J | K | L | M | N | O | P | Q | R | S | T | U | V | W | X | Y | Z |
Spectroscopy is a technique in which the visible light that comes from objects (like stars and nebulae) is examined to determine the object's composition, temperature, motion, and density.
 When something is hot enough to glow (like a star), it gives you information about what it is made of, because different substances give off a different spectrum of light when they vaporize. Each substance produces a unique spectrum, almost like a fingerprint.
In addition, different cool gases will absorb different wavelengths of light (and generate a signature spectrum with dark lines at a characteristic places). Because of this, you can determine the composition of gases by observing light that has passed through them.
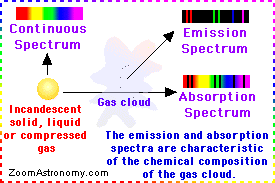
In fact, a substance will emit spectral lines (at a particular wavelength) when it is heated, and absorb light at the same wavelength when it is cool. When the substance emits light, a bright-line spectrum or an emission spectrum is generated (these look like a series of bright lines on a black background). When the substance absorbs light (at the same characteristic wavelength), the spectral pattern that is formed is called a dark-line spectrum or an absorption spectrum (these look like a series of dark lines on a rainbow).
For example, burning sodium (Na) will always produce two very close yellow lines (near the middle of the spectrum) on a black background, and it is the only element that will do exactly this. If you look at a light source and find these characteristic yellow lines, you know that there was sodium in the glowing object that produced this light. If you look at a light source and find dark lines in the same place on the spectrum, you know that the light you're seeing passed through sodium gas somewhere on its journey to you.
Examining the Sun:
Although we think of sunlight or starlight as white, it is really composed of a spectrum of colors - you can use a prism to break up sunlight into a rainbow (red, orange, yellow, green, blue, indigo and violet) - Isaac Newton was the first person to realize this. But when the spectrum is closely examined, the rainbow is interrupted by hundreds of tiny dark lines (called Fraunhofer lines). These lines show that some wavelengths are being absorbed by gases in the outer atmosphere of the Sun, and from this, we can determine which elements are in the Sun's atmosphere.
Why Does Each Element Have a Different Signature Spectrum?:
Each element has a different atomic structure, causing it to produce (or absorb) a different set of wavelengths. It's the actions of the electrons (tiny particles that surround the much heavier nucleus) jumping between different orbitals (the many places where the probability of finding an electron is the greatest) that produce the signature spectrum for an element.
When light (or other energy) is absorbed by the atom, an electron jumps from a low energy orbital to a higher energy orbital. When an electron returns to a less energetic orbital, light (or other electromagnetic radiation) is generated. There are actually many high energy orbitals that an electron can move to, so you can get emitted light in several different wavelengths. The bigger the difference in energy of the orbitals, the shorter the wave length of the light produced (or absorbed).
History of Spectroscopy:
Joseph von Fraunhofer (1787-1826), a German scientist and inventor, observed in the early 1800s that the continuous spectrum was marred by over 700 dark lines (now called Fraunhofer lines). No one knew what caused these lines until the work of G. R. Kirchhoff.
Spectroscopy was discovered in 1859 by Gustav Robert Kirchhoff and Robert Wilhelm Bunsen (of Bunsen burner fame). They made a prism-based device that separated the visible light emitted when substances were vaporized in the flame of Bunsen's specially-designed burner (it had a high-temperature, non-luminous flame). They determined that each gas had its own signature spectrum. Kirchhoff also realized that when emitted light passed through a cooler gas of the same substance, the bright spectral lines were replaced by dark ones - in the same position (1859). So a substance will emit spectral lines (at a particular wavelength) when it is heated, and absorb light at the same wavelength when it is cool.
Kirchhoff had explained the Sun's Fraunhofer lines - the dark lines in the solar spectrum (the light from the Sun) were the same as the emission lines observed by various heated chemical substances. Kirchhoff realized that the Sun was hot and gaseous.
The first person to use the technique of spectroscopy to examine celestial objects was William Huggins (in 1863). He determined that the Sun and the stars are composed mostly of the element hydrogen. He and his wife Margaret also examined the spectra of nebulae and comets.
Related Terms:
CONTINUOUS SPECTRUM A continuous spectrum is a spectrum of emitted light that contains all wavelengths of the colors that compose white light (red, orange, yellow, green, blue, indigo, violet, from long to short wavelength). Continuous spectra are emitted by incandescent solids, liquids, or compressed gases. If some discrete lines are missing from a spectrum, it is an absorption spectrum (indicating the presence of elements that absorb particular wavelengths). |
HUGGINS, WILLIAM and MARGARET Sir William Huggins (February 7, 1824-May 12, 1910) was an amateur English astronomer who was the first person to use spectroscopy to determine the compositions of astronomical objects (in 1861). He determined that the Sun and the stars are composed mostly of the element hydrogen. He also examined the spectra of nebulae and comets. Huggins' wife (they were married in 1875), Margaret Lindsay Murray Huggins (1848-1915), was a self-taught astronomer who did extensive work in spectroscopy and photography. Margaret studied the Orion Nebula extensively. William and Margaret were the first people to realize that some nebulae, like the Orion Nebula, consisted of amorphous gases (and were not a congregation of stars, like the nebula Andromeda). A lunar crater, a Martian crater, and an asteroid (#2635 Huggins) have been named for William Huggins. |
INCANDESCENT An incandescent material is so hot that it glows, producing light. Incandescent solids, liquids, and compressed gases produce a continuous spectrum; other gases produce a line or emission spectrum (only a few wavelengths are emitted). |
SPECTRAL LINE A spectral line is a bright or dark line found in the spectrum of some radiant source. Bright lines indicate emission, dark lines indicate absorption. A bright spectral line represents light emitted at a specific frequency by an atom or molecule. Each different element and molecule gives off light at a unique set of frequencies. Astronomers can determine the composition of gases in stars by looking for characteristic frequencies. For example, carbon monoxide (CO) has a spectral line at 115 Gigahertz (equal to a wavelength of 2.7 mm). |
SPECTRAL TYPE The spectral type of stars is a system of classification of stars based on the stars' spectra, emission lines that correlate with each star's surface temperature (and color). There are seven major spectral types. Stars range from blue and hot to red and cool. The spectral types are: O, B, A, F, G, K, and M (from hottest to coolest). Each of these letters is divided into 10 numerical classes, from hotter to cooler: 0, 1, 2, 3, 4, 5, 6, 7, 8, and 9. For example, our Sun has the spectral type G2. |
SPECTROGRAPH A spectrograph is an image of the electromagnetic spectrum of a light source. Spectrographs identify which elements are present in that star. |
SPECTRUM The spectrum is the band of colors that white light is composed of, in the order: red, orange, yellow, green, blue, indigo, violet (from long to short wavelength). Newton first discovered that sunlight could be divided into the visible spectrum. |
STELLAR CLASSIFICATION Stars can be classified by their surface temperature and their absorption spectra. There are seven main types of stars. In order of decreasing temperature, they are: O - He II absorption; B - He I absorption; A - H absorption; F - Ca II absorption; G - strong metallic lines; K -bands developing; M - very red. O and B stars are uncommon but very bright; M stars are common but dim. The Sun is a G star, about average. The standard mnemonic for remembering the classes is: Oh Be A Fine Guy Kiss Me. It is supplemented by the giants and supergiants: R- and N-type stars (also known as carbon stars or C-type stars) and S-type stars. |
|
|||||||
| A | B | C | D | E | F | G | H | I | J | K | L | M | N | O | P | Q | R | S | T | U | V | W | X | Y | Z |
Enchanted Learning®
Over 35,000 Web Pages
Sample Pages for Prospective Subscribers, or click below
|
Overview of Site What's New Enchanted Learning Home Monthly Activity Calendar Books to Print Site Index K-3 Crafts K-3 Themes Little Explorers Picture dictionary PreK/K Activities Rebus Rhymes Stories Writing Cloze Activities Essay Topics Newspaper Writing Activities Parts of Speech Fiction The Test of Time
|
Biology Animal Printouts Biology Label Printouts Biomes Birds Butterflies Dinosaurs Food Chain Human Anatomy Mammals Plants Rainforests Sharks Whales Physical Sciences: K-12 Astronomy The Earth Geology Hurricanes Landforms Oceans Tsunami Volcano |
Languages Dutch French German Italian Japanese (Romaji) Portuguese Spanish Swedish Geography/History Explorers Flags Geography Inventors US History Other Topics Art and Artists Calendars College Finder Crafts Graphic Organizers Label Me! Printouts Math Music Word Wheels |
Click to read our Privacy Policy
| Search the Enchanted Learning website for: |